The Science
Hydration testing, sweat analytics, a hydration wearable with new technology.
How does this device work?
What is the science behind it?
Sweat and electrolytes
Up to 60% of the human adult body is water. Sweating is the cooling process your body goes through to help you maintain a steady body temperature. Believe it or not, your body is constantly perspiring and regulating your temperature. Your sweat is composed of electrolytes, sometimes referred to salts. Those electrolytes are mixed with water in your sweat and they can carry electrical current.
Our hydration sensor & monitor
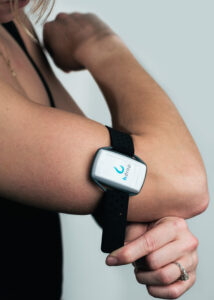
Our device has a new and novel sensor configuration. This sensor sends a tiny and harmless current through the top of your skin. Whenever you sweat electrolytes, the sensor is able to detect the amount of electrical resistance across the electrolytes. Knowing the amount of electrolytes that you are losing, hDrop can track and estimate your hydration status. Isn’t it cool?


CONSEQUENCES OF DEHYDRATION
Studies show that the majority of endurance athletes are physically impaired during their workouts and competitions due to dehydration, despite the access they have to fluids. Dehydration causes the following physiologic effects on our bodies:
- DECREASED BLOOD FLOW TO EXTREMITIES
- INCREASED RESPIRATORY RATE
- INCREASED HEART RATE
- DECREASED BLOOD PRESSURE
These effects can lead to cardio-respiratory problems, impaired thermoregulation, increase fatigue, adverse cognitive effects, and weakness. All of these have a significant impact on athletic performance and make a difference while performing on the field.
The symptoms of mild dehydration are often imperceptible, athletes are suffering the consequences without always knowing it.
Understanding your metrics
hDrop provides a set of metrics and data points during your activities. First, we will give an overall short explanation of the metrics displayed on your activities. Then, we will provide you with the right analytic tools to understand your graphs. Let’s dive deeper into your hydration!
Fluid Loss
This metric represents the total amount of fluid you lost during your activity. Used to calculate hydration scores and performance metrics.
Sweat Rate
The amount you sweat over time. It indicates how much you sweat per minute on average during your activity. Helps calculate the fluid loss.
First Sweat Drop
This data point indicates when your body started sweating. It is represented by the number of minutes that it took for your glands to start releasing sweat.
Sodium Loss
Sodium is the main electrolyte to keep in mind when we are talking about sweat and athletic performance. The average person’s sweat contains only 150mg of potassium per liter, while sodium can account for up to 2,000mg per liter. This metric will let you analyze your sodium spectrum.
Potassium Loss
Potassium is mainly regulated by the kidneys and is primarily lost in the urine. But you also lose potassium when you perspire. And more perspiration equals more potassium lost.
Estimated BODY Temperature
Temperature is directly correlated with your perspiration. This metric indicates your estimated body temperature during your activity. During exercise, your temperature can easily reach above 104 degrees Fahrenheit or 40 degrees Celsius. Body temperature is increased during whole-body continuous work and exercise.
Two types of analysis
Upper Arm
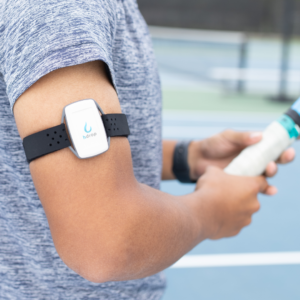
hDrop is placed on your upper arm for light or intense activities. This type of analysis takes a little bit more time to show real-time results since it requires your upper arm to start sweating, but at the same time, this analysis will give you the biggest amount of metrics. How do we interpret those? Let’s start with your hydration score during your light or intense activity.
Light or intense activity thresholds *
- 100 to 50 - Good hydration
- 50 to 30 - Mild dehydration
- Less than 30 - Dehydration
*Keep in mind that hDrop is not a medical device. These scores are just feedback. The user is responsible for any actions taken using these metrics.
Quick Finger Reading

The quick finger reading lets hDrop analyze your sweat in just 80 seconds. Did you know that your hand palm (including your thumb) has a huge amount of sweat glands? The region with the greatest sweat gland density is the palms and soles of the feet, which contain 600–700 sweat glands/cm2. How do we interpret the reading from a thumb test? Let’s look at the hydration score scale.
Thumb test thresholds*
- 100 to 85 - Good hydration
- 85 to 60 - Mild dehydration
- Less than 65 - Dehydration
*Keep in mind that hDrop is not a medical device. These scores are just feedback. The user is responsible for any actions taken using these metrics.
Learn about your hydration
Interpret your results
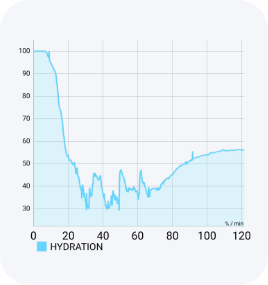
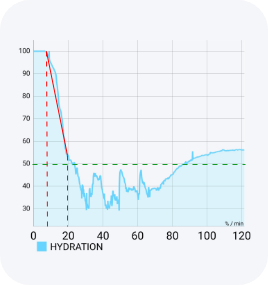
Let’s take a look at your hydration graph. Your hydration graph shows all your hydration scores recorded in real-time during your workout. This graph contains the most valuable data and feedback. The x-axis (horizontal) is time (minutes) and the y-axis (vertical) is your hydration score (from 0 – 100).
Let’s start at the beginning!
Starting to sweat
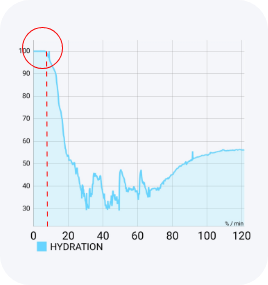
If we look at the beginning of the workout, we can see an initial flat line. This flat line indicated that the user was not sweating at all. It will be indicated as a “100”. Don’t get confused! 100 does not mean 100% hydrated. It means the sensor is unable to read any sweat, and this only applies for the beginning of the workout. Let’s look closer, check when the graph starts to drop. You are right, that means that it took ~7 minutes for the user to start sweating. hDrop is the first wearable device able to track this metric. Isn’t it cool?
The big drop
Every so often we encounter the question: Why my hydration drops so rapidly at the beginning? That is because your body starts the process of cooling down your core temperature by generating more sweat. This generates the initial drop that will then stabilize. As soon as it stabilizes, that number will be your baseline value. The baseline value is calculated by taking the end of the big drop and calculating the average values during your workout (the green line shows the baseline value, ~50 for this example). Everyone’s sweat is different, and thus there will be different baselines for everyone. Some users will have a 40 as a baseline, some will have a 60 as a baseline. This hydration score indicates how much you are losing. The lower your baseline, the more indicative you are of a heavy sweater. The higher your baseline values indicate that you are a lighter sweater. This is a pretty important thing to know, especially for high endurance athletes. Know your body, and then take actions to improve.
Fluid intakes
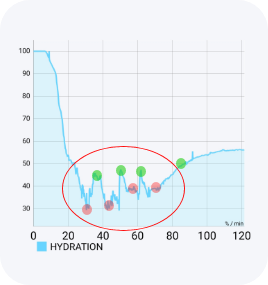
Our app offers you the option to manually input your fluid intakes, but…Is that really needed? Not at all! You can mark them manually to later visualize them, but the hydration scoring graph will illustrate when you drink (red dots) and how your body reacts to it going up (green dots). We can calculate the time your body takes to react to those liquid intakes (distance between red dot and green dot).
Time to rest and recover
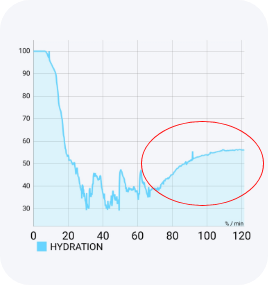
hDrop can also detect types of activities, including when you start resting. As soon as you finish your activity and begin resting, you will see how the graph stabilizes. If you start your recovery plan and start replenishing fluid, you will see the graph trending upwards. hDrop will also provide you with a recovery plan when you finish your activity through the app!
HOW CAN YOU IMPROVE?
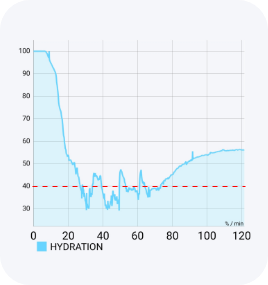
Keep it stable! With hDrop now you have more data points than ever about your hydration. Balancing the right amount of electrolytes and water intakes you do during your activities is key for success. Try keeping the graph as steady as possible after the first initial drop (indicating that your body started sweating). Play with different workout activities and use the live hDrop feedback for when, what, and how much to drink, as a guide for your workouts. Ready, set, sweat!

