
Personalized Soccer Hydration: 7 Lessons From Elite Players
Personalized soccer hydration works best when sweat rate, sodium concentration, recovery status, training load, and session context are interpreted together instead of averaged across the whole team.
There is a simple mistake that shows up in many team hydration plans: the squad gets treated like one athlete. One bottle mix. One sodium target. One sweat profile. One generic pre-match reminder to drink enough.
That approach is tidy for logistics, but it does not match how elite soccer players respond to training. Soccer is intermittent, position-specific, environmentally variable, and highly individual. A winger can repeat more high-speed actions than a center back. A player returning from fatigue can show a different autonomic profile than a teammate in the same session. Two players can finish the same drill with similar perceived fatigue but very different sweat and sodium losses.
A recent RCD Espanyol first-team field monitoring project supplied for this article makes that practical problem visible. The project followed six professional players across six weeks and combined WHOOP HRV data, WIMU PRO high-speed running outputs, hDrop Gen 2 sweat rate and sodium concentration, CR-10 post-session RPE, and weather temperature. The project is an applied field case, not a peer-reviewed trial. The recommendations below are therefore grounded in the peer-reviewed soccer, hydration, sweat, and monitoring literature listed in the Sources section.
1. The problem: team averages can hide the player who needs a different plan
The first lesson is that an average can be technically correct and still practically misleading. Peer-reviewed sweat research has repeatedly shown wide intra- and interindividual variability in sweat rate and sweat sodium concentration. Baker’s review describes sweat sodium concentration as highly variable across athletes and testing contexts, and Barnes and colleagues reported sport-level normative data showing that fluid and sodium losses differ meaningfully by athlete and sport.
That matters in soccer because players do not perform a steady endurance task. Match-play includes walking, jogging, repeated accelerations, high-speed running, decelerations, collisions, tactical pauses, and heat exposure that changes by venue and time of day. Nutrition guidance from the UEFA expert group emphasizes practical, individualized strategies for elite football because player needs vary by role, workload, environmental stress, and match calendar.
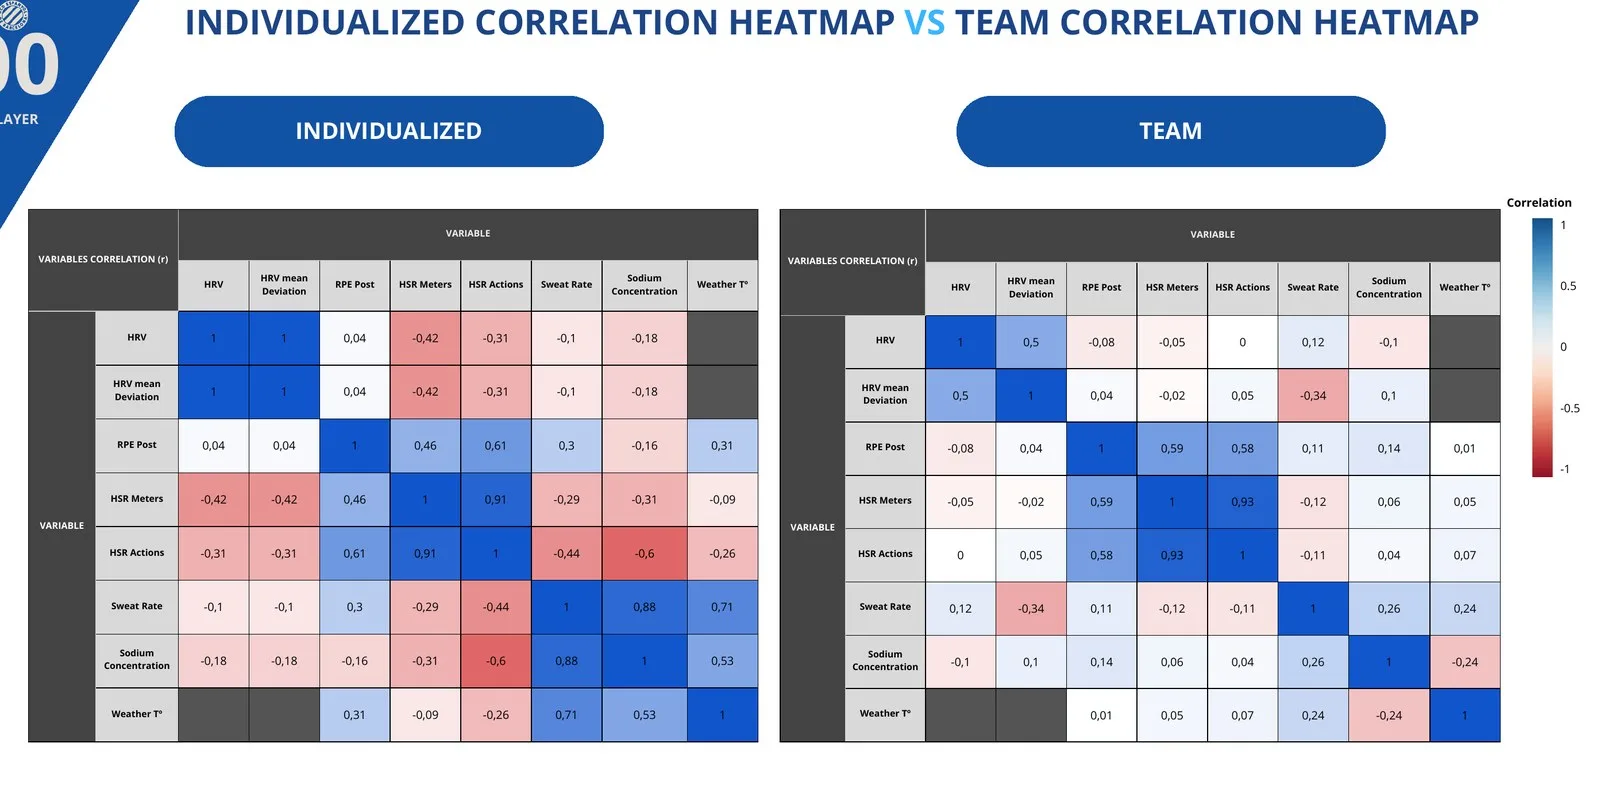
The RCD Espanyol field project showed the same principle in a small applied setting. At team level, several correlations were weak or moderate. At individual level, however, some players showed strong relationships that were lost when the data were averaged. That does not mean every correlation should be treated as causal. It means a team average is a screening tool, not a prescription.
| Field project element | Value or unit | Practical interpretation |
|---|---|---|
| Players monitored | 6 first-team players | Useful field signal, but small sample size |
| Monitoring window | 6 weeks | Enough to observe patterns, not enough for universal rules |
| Session timing | MD-4 and MD-3 | Hydration should be tagged by microcycle day |
| Ambient temperature | 16.33 +/- 2.66 °C | Individual differences appeared even in mild conditions |
| Sweat rate | L/h | Estimates fluid loss per hour of training or match-play |
| Sodium concentration | mmol/L | Helps distinguish high-volume sweaters from high-sodium sweaters |
2. Personalized soccer hydration starts by separating fluid loss from sodium concentration
Sweat rate and sweat sodium concentration are related, but they are not the same decision. Sweat rate tells staff how much fluid a player is losing per hour. Sodium concentration tells staff how much sodium is contained in each liter of sweat. Total sodium loss depends on both.
That distinction matters because a player can have a high sweat rate with moderate sodium concentration, a moderate sweat rate with high sodium concentration, or a high value for both. If a staff member only looks at body mass change, they may catch fluid loss but miss sodium concentration. If they only look at sodium concentration, they may miss total fluid loss. Personalized hydration requires the combined equation: sweat rate multiplied by sodium concentration, then adjusted for duration and context.
The RCD Espanyol field data gave a clear example. Player 00 showed a strong positive relationship between sweat rate and sodium concentration (r = 0.88; p = 0.05). In practical terms, that player tended to lose more sodium per liter as sweat rate increased. Another player did not show the same pattern. A team sodium target would blur that difference.
Peer-reviewed soccer and sweat data support this need for individualization. Barnes and colleagues reported football/soccer normative values near 0.94 +/- 0.38 L/h for sweat rate and 34.6 +/- 19.2 mmol/h for sweat sodium loss. Suarez-Ortegon and colleagues observed professional male soccer players training in hot conditions with sweat rates around 1.7 +/- 0.5 L/h and sweat sodium concentration around 26.7 +/- 11.3 mmol/L. Baker’s broader review reports sweat sodium concentrations that can span roughly 10 to 90 mmol/L across athletes and methods.
| Evidence point | Reported value | What it means for a soccer plan |
|---|---|---|
| Normative soccer sweat rate | ~0.94 +/- 0.38 L/h | Use as a starting benchmark, not a player prescription |
| Normative soccer sodium loss | ~34.6 +/- 19.2 mmol/h | Total sodium loss varies enough to justify individual testing |
| Hot-condition soccer sweat rate | ~1.7 +/- 0.5 L/h | Heat can move a player into a higher replacement range |
| Broad sweat sodium concentration range | ~10-90 mmol/L | Two players can lose very different sodium amounts at the same sweat volume |
The clearest example of within-player variability was Player 05. Across sessions, this player’s sweat sodium concentration ranged from 938.8 to 1,544.8 mg/L, while estimated sodium loss rate ranged from about 945 to 1,860 mg/h when sweat rate was included. In practical terms, the same athlete could lose almost twice as much sodium per hour depending on the session and conditions. This does not prove a single cause, but it shows why a fixed sodium target can be too blunt: hydration plans should account for the player, session type, sweat rate, sodium concentration, temperature, and training load together.
For Player 05, the highest estimated sodium loss rates appeared in the earlier sessions: on March 26, 2026 (MD-3), sweat rate was 1.27 L/h and sodium concentration was 1,464.3 mg/L, giving an estimated sodium loss of about 1,860 mg/h; on April 7, 2026 (MD-4), it was about 1,778 mg/h; and on April 8, 2026 (MD-3), it was about 1,823 mg/h. Later sessions were much lower: April 20, 2026 was about 989 mg/h, April 30, 2026 was about 976 mg/h, and May 6, 2026 was about 945 mg/h. So, across the same player, the observed sodium loss rate moved from roughly 0.95 g/h to 1.86 g/h depending on the session date, intensity, sweat rate, sodium concentration, and other conditions.
3. Training load changes the hydration question
Soccer practitioners already know that external load and internal load are not interchangeable. High-speed running meters and high-speed running actions describe the work performed. RPE, heart rate, HRV, and other physiological markers help describe how the athlete responded. Peer-reviewed monitoring work in soccer supports this integrated approach, including the classic use of session RPE for soccer training load and newer reviews arguing that intensity in soccer should not be reduced to a single metric.
The RCD Espanyol data were consistent with that view. At team level, RPE Post correlated positively with HSR Meters (r = 0.59; p < 0.01) and HSR Actions (r = 0.58; p < 0.01). Player 05 showed similar but more individualized patterns, with RPE Post related to HSR Meters (r = 0.66; p = 0.04) and HSR Actions (r = 0.68; p = 0.04). Those relationships are not hydration prescriptions by themselves, but they help identify when a session may require closer fluid and sodium review.
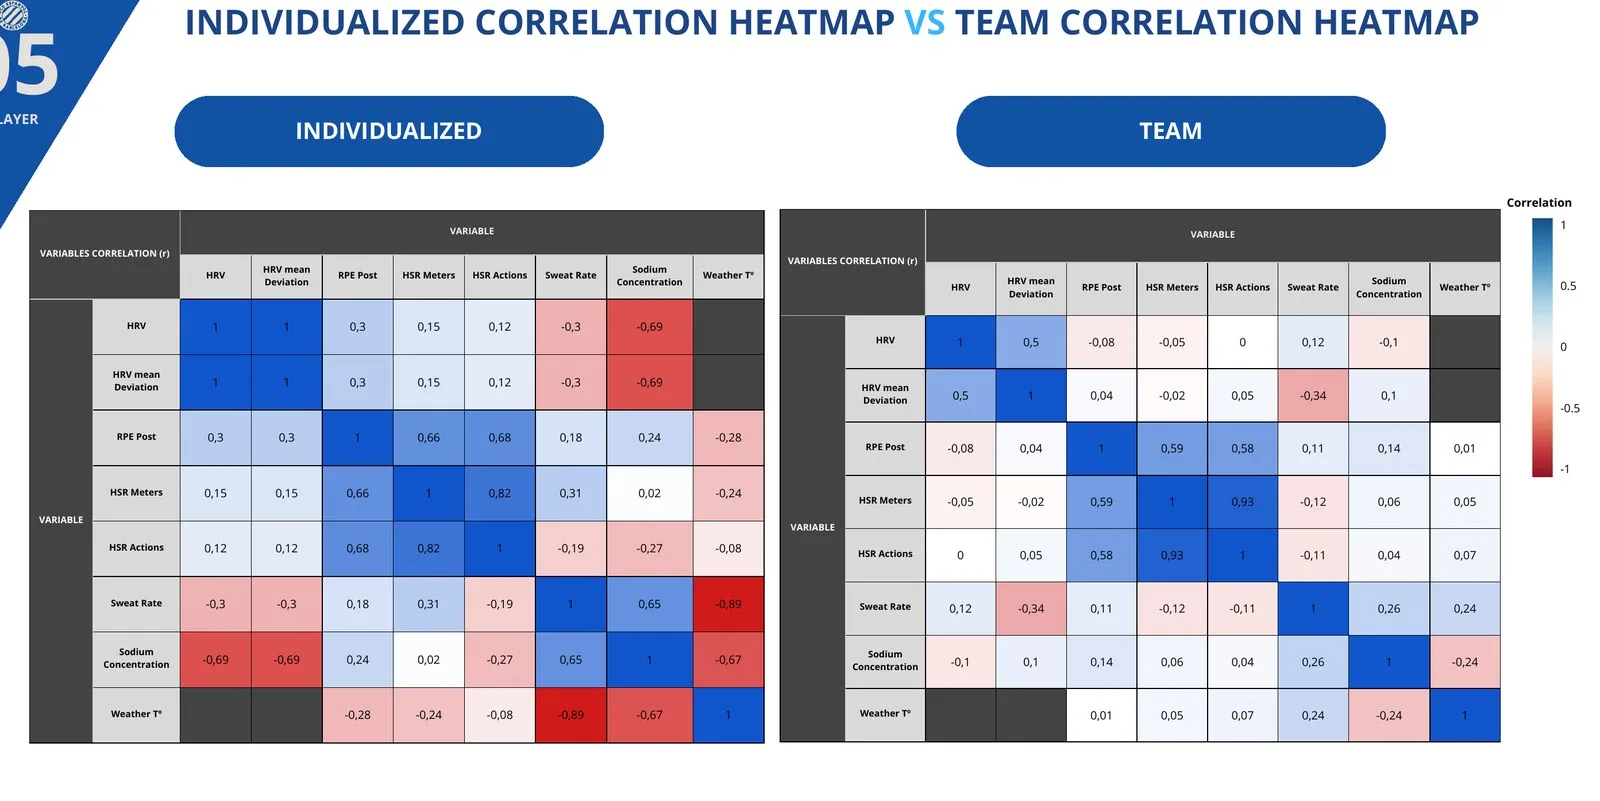
For example, a high-speed session may not produce the same sweat response in every player. One athlete may produce more sweat because the session adds thermal and cardiovascular strain. Another may report high exertion because of neuromuscular load, tactical demands, or accumulated fatigue, without a proportional rise in sweat rate. The hydration plan should therefore ask, “What did this player lose in this type of session?” rather than, “What does the average player lose?”
4. Recovery status may help flag hydration risk, but it should not replace sweat data
HRV can be useful because it reflects autonomic nervous system status, especially when collected consistently under standardized conditions. WHOOP validation work supports reasonable heart rate and HRV measurement accuracy in applied contexts, while HRV best-practice literature emphasizes that interpretation depends on baselines, repeated measurement, and context.
The RCD Espanyol project found that HRV alone did not consistently predict performance or physiological status. That is an important result. It argues against turning HRV into a magic readiness number. Still, one team-level relationship stood out: HRV Mean Deviation and Sweat Rate showed a negative association (r = -0.34; p = 0.05). Player 04 showed a much stronger individual version, with HRV/HRV Mean Deviation negatively related to Sweat Rate (r = -0.87; p = 0.02).
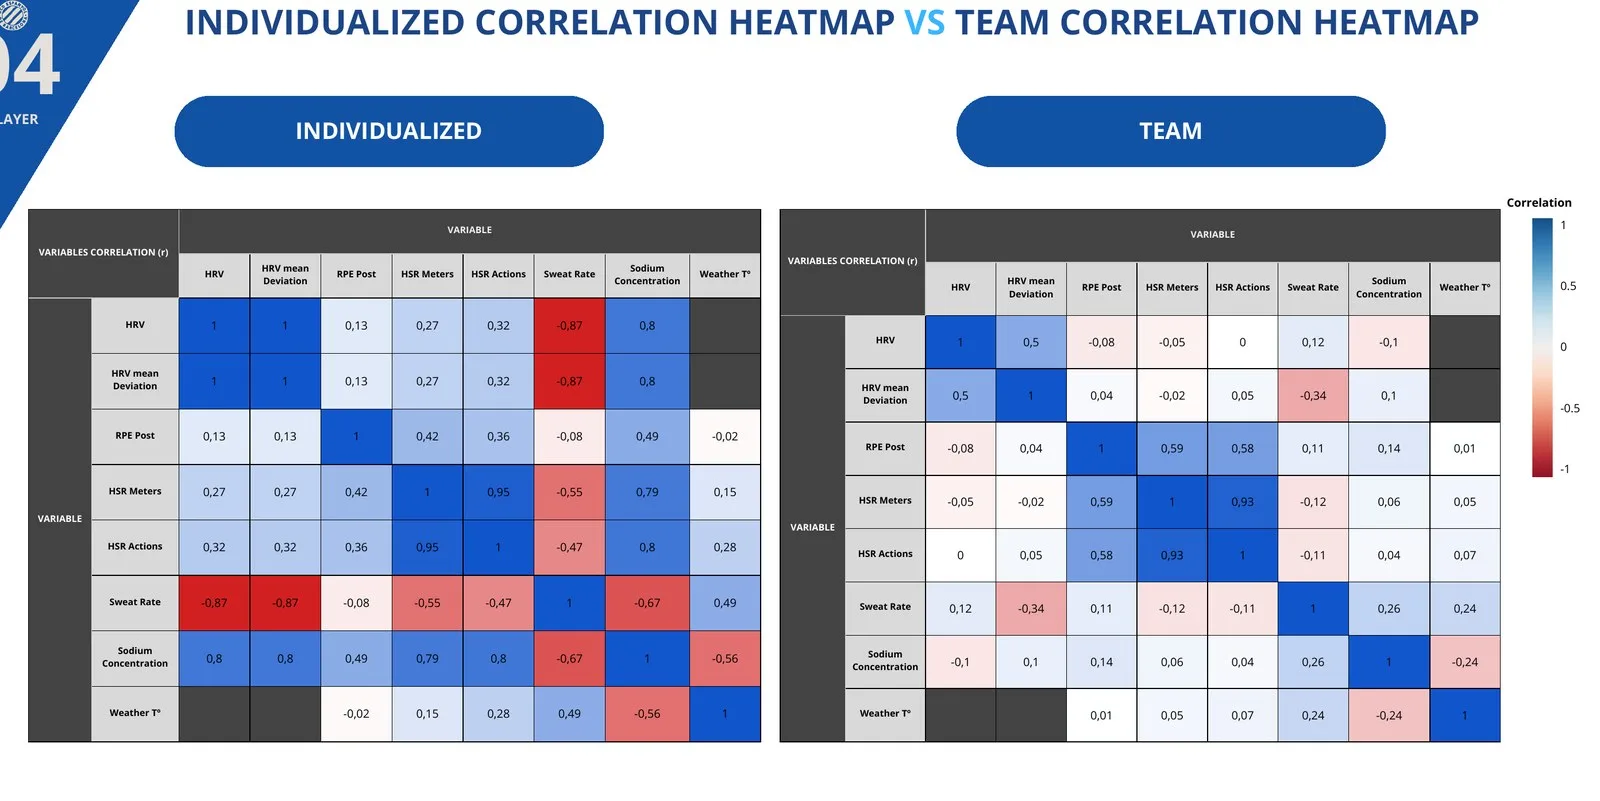
A cautious interpretation is that some lower-recovery states may coincide with higher sweat losses for some players. A stronger interpretation would be premature. The sample was small, baseline HRV history was limited, and correlation does not prove causation. The practical takeaway is narrower: if a player’s recovery marker is unusually low, staff can use that as a prompt to verify sweat, body mass change, urine color or specific gravity where available, subjective wellness, and planned heat exposure. HRV can help trigger a check; it should not replace the check.
| RCD field pattern | Correlation | Practical use |
|---|---|---|
| Team: HRV Mean Deviation vs Sweat Rate | r = -0.34; p = 0.05 | Use lower recovery signals as a reason to review hydration risk |
| Player 00: Sweat Rate vs Sodium Concentration | r = 0.88; p = 0.05 | Higher sweat output may also mean higher sodium concentration for this player |
| Player 04: HRV/HRV Mean Deviation vs Sweat Rate | r = -0.87; p = 0.02 | This player may need closer fluid checks on low-recovery days |
| Player 05: RPE Post vs HSR Actions | r = 0.68; p = 0.04 | High-speed work matched perceived demand for this player |
5. Session context is the missing layer in many hydration plans
A single “player average” is better than no measurement, but it is still blunt. The RCD Espanyol thesis specifically suggested tagging hydration data by session type, such as MD-4, MD-3, simulated match sessions, and other training contexts. That recommendation is practical because soccer microcycles change the physiological question.
MD-4 may include different tactical, volume, and intensity demands than MD-3. A recovery session may create a very different sweat profile than a high-speed exposure day. A hot afternoon match does not behave like a cool evening tactical session. Position also matters because adult male soccer match demands differ by role, and high-intensity running is distributed unevenly across players and phases of play.
For hydration, the best unit of analysis is not simply “Player A.” It is “Player A in this session type, under these conditions, with this recent recovery state.” That is the level where a hydration plan becomes useful for staff and actionable for the athlete.
6. Practical protocol for athletes
Use this protocol to move from generic advice to personalized soccer hydration without overcomplicating the workflow.
- Build a baseline over repeated sessions. Record pre- and post-session body mass, session duration, fluid consumed, urine losses if practical, sweat rate, sodium concentration, RPE, temperature, and session type.
- Tag every record by context. Separate MD-4, MD-3, match day, recovery, gym, high-speed exposure, heat training, travel, and return-to-play sessions.
- Calculate fluid loss first. Estimate sweat rate in L/h and identify sessions where body mass loss trends toward or beyond 2%.
- Calculate sodium loss second. Convert sweat sodium concentration and sweat volume into estimated total sodium loss for the session.
- Set replacement ranges, not rigid numbers. Give each player a normal, high-heat, and high-load range for fluid and sodium rather than one universal target.
- Use recovery data as a review flag. If HRV, resting heart rate, sleep, soreness, or wellness is off, re-check hydration execution before assuming the issue is only fitness.
- Re-test when context changes. Reassess when weather shifts, training phase changes, match congestion increases, the athlete changes body mass, or heat acclimation develops.
For most athletes, the goal during training is not always to replace 100% of sweat losses in real time. The goal is to prevent excessive fluid deficit, avoid overdrinking, replace sodium when losses are meaningful, and arrive at the next session recovered enough to perform. The right target depends on duration, heat, access to fluids, gastrointestinal tolerance, and the athlete’s measured loss profile.
7. How hDrop data can help decision-making
hDrop Gen 2 can add value because it measures sweat rate and sodium concentration in real time during exercise, rather than forcing staff to rely only on post-session estimates. Used correctly, it can help practitioners compare a player’s fluid and sodium losses across session types, environmental conditions, and microcycle days.
8. Limitations and uncertainty
The RCD Espanyol field project should be treated as an applied case example, not proof that the observed relationships apply to every soccer player. The sample included six players, the observation window was six weeks, not every variable was available in every session, and the HRV deviation calculation was limited by the absence of a longer individual baseline. The mild average temperature also means the results should not be treated as direct evidence for extreme heat match-play.
Several broader scientific uncertainties remain. Regional sweat measurements can differ from whole-body sweat sodium loss, so equations and device algorithms matter. HRV can be useful, but it is sensitive to measurement protocol and should be interpreted with resting heart rate and longitudinal trends. Soccer intensity is multidimensional, so HSR, RPE, HRV, and sweat data each describe part of the picture. Evidence is strongest when those signals are combined with repeated athlete-specific monitoring rather than used in isolation.
Key takeaways
- Personalized soccer hydration should separate fluid loss, sodium concentration, total sodium loss, and session context.
- Team averages are useful for planning logistics, but individual players can show very different sweat and sodium patterns.
- Training load and recovery markers can help identify when hydration needs deserve closer review.
- Session tags such as MD-4, MD-3, match day, recovery, heat, and high-speed exposure make hydration data more actionable.
- hDrop data is most useful when combined with body mass change, RPE, weather, and practitioner judgment.
Sources
- Baker LB. Sweating Rate and Sweat Sodium Concentration in Athletes: A Review of Methodology and Intra/Interindividual Variability. Sports Medicine. 2017.
- Barnes KA et al. Normative data for sweating rate, sweat sodium concentration, and sweat sodium loss in athletes: An update and analysis by sport. Journal of Sports Sciences. 2019.
- Collins J et al. UEFA expert group statement on nutrition in elite football. British Journal of Sports Medicine. 2021.
- Suarez-Ortegon MF et al. Sweat Rate, Sweat Sodium Losses, and Body Composition in Professional Male Soccer Players in Southwest Colombia. Medicina. 2024.
- Shirreffs SM, Sawka MN, Stone M. Water and electrolyte needs for football training and match-play. Journal of Sports Sciences. 2006.
- Gibson JC et al. Hydration status and fluid and sodium balance in elite Canadian junior women’s soccer players in a cool environment. Applied Physiology, Nutrition, and Metabolism. 2012.
- Hulton AT et al. Energy Requirements and Nutritional Strategies for Male Soccer Players: A Review and Suggestions for Practice. Nutrients. 2022.
- Impellizzeri FM et al. Use of RPE-Based Training Load in Soccer. Medicine & Science in Sports & Exercise. 2004.
- Pillitteri G et al. Toward a New Conceptual Approach to “Intensity” in Soccer Player’s Monitoring. Journal of Strength and Conditioning Research. 2023.
- Bellenger CR et al. Wrist-Based Photoplethysmography Assessment of Heart Rate and Heart Rate Variability: Validation of WHOOP. Sensors. 2021.
- Gomez-Carmona CD et al. Using an Inertial Device (WIMU PRO) to Quantify Neuromuscular Load in Running. Journal of Strength and Conditioning Research. 2020.
- Sarmento H et al. The Influence of Playing Position on Physical, Physiological, and Technical Demands in Adult Male Soccer Matches. Sports Medicine. 2024.
- Baker LB et al. Cross-validation of equations to predict whole-body sweat sodium concentration from regional measures during exercise. Physiological Reports. 2020.