
Pro Triathlete Lionel Sanders Uses hDrop to Track Sweat and Sodium Loss
Pro triathlete Lionel Sanders uses hDrop to put numbers behind something he has known for years: he loses a lot of fluid when he trains, even when the pace feels easy.
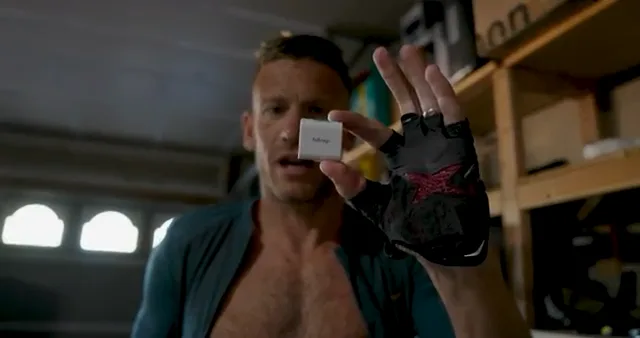
In The Cost of Fitness, Sanders pulls out the sensor and walks through the readings from a ride. He talks about sweat rate, fluid loss, and sodium in the same practical way he talks about watts or training volume. He wants a measurement he can compare with his own lab results and with the change in his body mass before and after a session.
The clip below begins at 2:19, when Sanders starts discussing hDrop. Near the end of the ride, the screen shows 4.05 L of fluid loss, a sweat rate of 1.88 L/h, a sweat sodium concentration of 1,300 mg/L, and 5,253 mg of total sodium loss.
Those figures are personal to Sanders and to this ride. What makes the clip useful is the way he handles them. He checks whether the numbers agree with one another, compares the sodium reading with three earlier lab tests, and says he will use his body mass to check the total fluid loss. It is a clear look at one hDrop user building confidence in his own training data over time.
1. The exact hDrop data Lionel Sanders showed
Sanders reads the four results aloud at the end of the ride: 4.05 L of fluid loss, 1.88 L/h sweat rate, 1,300 mg/L sweat sodium concentration, and 5,253 mg of total sodium loss. Each value describes a different part of the session.
| Metric shown by Sanders | Displayed value | What the value describes |
|---|---|---|
| Total fluid loss | 4.05 L | Estimated sweat fluid lost across the recorded ride |
| Sweat rate | 1.88 L/h | Estimated fluid lost through sweat each hour |
| Sweat sodium concentration | 1,300 mg/L | Estimated sodium in each liter of sweat |
| Total sodium loss | 5,253 mg | Estimated sodium lost through sweat across the ride |
Earlier in the video, he says easy pedaling can put his sweat rate near 1.75 L/h. He also recalls three lab tests, taken at different times of year, that measured his sweat sodium concentration between 1,200 and 1,500 mg/L. The hDrop result sits close to both parts of that history: the hourly rate is familiar, and the sodium reading falls inside his previous lab range.
Sweat rate tells Sanders how quickly he is losing fluid. Sodium concentration tells him how much sodium is in that fluid. The totals show how those rates add up over a full ride. Athletes can differ widely on both measures, and the same athlete can see them shift with conditions. That is why Sanders’s own history gives the readings more meaning than a population average would (Baker, 2017; Baker et al., 2016).
2. The four numbers cross-check remarkably well
Sanders’s four readings also describe the same ride cleanly. Multiplying 4.05 L by 1,300 mg/L gives 5,265 mg of sodium. The screen shows 5,253 mg, a difference of 12 mg, or about 0.2%. Rounded values on the screen can easily account for a gap that small.
The fluid figures tell a similar story. At 1.88 L/h, a total of 4.05 L works out to about 2.15 hours, or roughly 2 hours 9 minutes. Sanders refers to it conversationally as a two-hour easy ride, so the implied duration fits his description.
| Cross-check | Calculation | Result | What it tells us |
|---|---|---|---|
| Sodium total from fluid and concentration | 4.05 L × 1,300 mg/L | 5,265 mg | 12 mg above the displayed total of 5,253 mg |
| Implied recorded duration | 4.05 L ÷ 1.88 L/h | 2.15 h | About 2 h 9 min, in line with Sanders’s description |
| Fluid loss over exactly two hours | 1.88 L/h × 2 h | 3.76 L | The amount implied by the displayed hourly rate |
| Sodium loss rate | 1.88 L/h × 1,300 mg/L | 2,444 mg/h | The estimated hourly loss during this ride |
The arithmetic shows that the displayed outputs fit together. Accuracy is a separate question, answered by comparing a device with a suitable reference method. Sweat readings can shift with sensor location, collection method, exercise intensity, and weather, so a clean calculation is one check among several (Baker et al., 2009; Baker et al., 2019).
3. Sanders’ field concentration fits his previous lab pattern
The 1,300 mg/L sodium reading matters because Sanders has something personal to compare it with. He says three earlier lab tests placed him between 1,200 and 1,500 mg/L across summer, winter, and spring. His field result falls near the middle of that range.
That comparison says more about Sanders than a label such as “salty sweater.” Sweat sodium concentration varies widely between athletes. Season, exercise type, air temperature, body region, and the testing method can all influence a reading (Baker et al., 2016; Baker et al., 2022). A review of seasonal heat acclimatisation also found lower sweat sodium concentration after summer exposure in several studies, though the methods varied and most participants were healthy adult men (Brown et al., 2022).
Sanders is looking for a pattern rather than hanging a plan on one reading. He compares hDrop with lab work and says he checks fluid loss through pre- and post-training body mass. For that calculation, an athlete adds fluid consumed during the session and subtracts urine produced. Done carefully, it gives a practical estimate of whole-body sweat loss (Kenefick, 2018).
When the field reading, body-mass check, and earlier lab work point in the same direction, Sanders has more reason to trust the pattern. A large mismatch would be useful too. It would give him a reason to check sensor placement, drink records, conditions, or the timing of the session.
4. An easy ride can still create a large cumulative loss
Sanders calls the ride easy and mentions riding at about 230 watts. Two hours of easy work still leaves him with an estimated 4.05 L of fluid loss. The session label says little about how much a specific athlete will sweat.
Work rate matters, but it shares the picture with air temperature, airflow, clothing, body size, acclimation, and individual physiology. The body also responds to total time. A moderate hourly rate can become a large total over a long session, while Sanders starts with a high rate even at an easy pace. Research on exercise in heat describes the same interaction between the athlete, the work, and the surrounding conditions (Périard et al., 2021).
He places the ride inside a longer day of easy volume that includes a 6 km swim and an easy run, roughly four to four and a half hours altogether. That changes the question. The bike reading can help him think about the fluid and sodium he has lost before the day is over, as well as the recovery needed before his next session.
At 1.88 L/h, exactly two hours would equal about 3.76 L of sweat. At 1,300 mg/L, that volume would contain about 4,888 mg of sodium. These remain loss estimates. Fluid consumed, starting hydration, urine output, and recovery after the ride determine his net balance. Even so, the hDrop screen gives Sanders a concrete record of what an ordinary-feeling ride may cost across a long training day.
5. A large loss is not a command to replace 100% during the ride
A screen showing more than 5 g of sodium loss can look like a target. It answers a different question: how much sodium the athlete appears to have lost in sweat. A workable intake plan also has to account for thirst, stomach comfort, body-mass change, session length, fluid availability, and what the athlete can tolerate while moving.
Drinking beyond thirst and retaining excess fluid are major risk factors for exercise-associated hyponatremia, a dangerous drop in blood sodium during or after exercise.
For this ride, 2,444 mg/h describes Sanders’s estimated sodium loss rate. He can use it to frame the problem, then test a smaller, tolerable intake in similar training. Thirst, changes in body mass, stomach comfort, symptoms, urine, and recovery help him judge the result. Anyone with a medical condition, a history of hyponatremia, or unusually hard-to-manage fluid needs should work with a sports physician or sports dietitian.
6. How hDrop data can help decision-making
Sanders’s routine is the most interesting part of the video. He watches current sweat rate alongside total fluid loss, then reads sodium concentration alongside total sodium loss. Afterward, he compares the session with lab work and a body-mass check. Each piece answers a small question; together, they help him decide whether the reading makes sense.
Real-time data can also show how a session changes. Sanders can see whether his sweat rate stays steady during easy work or rises as the room, weather, or workload changes. The final total tells him how much those shifts added up to. Repeating the same kind of ride gives him a stronger baseline: Does he keep landing near 1.8 L/h? Does sodium remain near 1,300 mg/L? How close is the fluid total to his body-mass estimate?
He is also candid about placement. Sanders says the upper arm gives the most accurate reading, though he wore the sensor somewhere more convenient in the video. That detail belongs with the results because sweat sampled at one body site can differ from whole-body sweat, and the relationship depends on the method used (Baker et al., 2009).
7. Practical protocol for athletes
Sanders’s numbers belong to Sanders. Other athletes can borrow his habit of checking and repeating, while building their own range from familiar training sessions.
- Choose a repeatable session. Pick an easy ride or run with a familiar route, duration, clothing, and effort. Write down the temperature, humidity, indoor or outdoor setting, and strong wind.
- Standardize the sensor setup. Follow the recommended upper-arm placement and use the same side each time. Make a note whenever the placement changes.
- Measure body mass carefully. Weigh immediately before and after in minimal, dry clothing. Record everything consumed and any urine produced. Estimate sweat loss from the change in mass, plus intake, minus urine. Longer sessions bring more room for measurement error (Kenefick, 2018).
- Compare the right variables. Check hDrop’s total fluid loss against the body-mass estimate. Compare sodium concentration with your own earlier readings or lab work.
- Repeat before changing the plan. Complete at least three similar trials. When readings differ sharply, check placement, elapsed time, drink records, weather, and sensor contact.
- Test intake conservatively. Use the loss data to set a starting range, then try it during training. Keep fluid and sodium within amounts your stomach handles comfortably. Bloating, nausea, headache, confusion, unusual swelling, or weight gain during prolonged exercise call for an immediate reassessment.
- Separate training from racing. A plan that feels comfortable on an easy two-hour ride may feel different during an Ironman bike leg. Test it gradually at race-like intensity and in similar weather.
The result should be a personal range for a defined kind of session, paired with an intake plan the athlete can tolerate. Endurance hydration research supports plans based on the athlete and conditions rather than a rigid schedule copied from someone else (Baker, 2017; Kenefick, 2018).
Key takeaways
- Pro triathlete Lionel Sanders uses hDrop to track sweat rate, fluid loss, sweat sodium concentration, and total sodium loss during training.
- After this easy ride, he showed 4.05 L of fluid loss, 1.88 L/h sweat rate, 1,300 mg/L sweat sodium, and 5,253 mg of total sodium loss.
- The numbers agree: 4.05 L × 1,300 mg/L gives 5,265 mg, only 12 mg above the displayed sodium total.
- The 1,300 mg/L field result sits inside the 1,200–1,500 mg/L range Sanders recalls from three earlier lab tests.
- Sanders checks hDrop against repeat sessions and changes in body mass rather than treating one reading as a final answer.
- Loss estimates describe what happened during a workout. A fluid and sodium plan still needs testing for safety, comfort, and the demands of the session.
Video referenced
Lionel Sanders, The Cost of Fitness, hDrop segment beginning at 2:19. The video is the source for Sanders’s comments and the session values shown here. The studies below provide the scientific background.
Scientific sources
- Baker LB. Sweating rate and sweat sodium concentration in athletes: a review of methodology and intra/interindividual variability. Sports Medicine. 2017. https://doi.org/10.1007/s40279-017-0691-5
- Baker LB, Barnes KA, Anderson ML, Passe DH, Stofan JR. Normative data for regional sweat sodium concentration and whole-body sweating rate in athletes. Journal of Sports Sciences. 2016. https://doi.org/10.1080/02640414.2015.1055291
- Baker LB, Stofan JR, Hamilton AA, Horswill CA. Comparison of regional patch collection vs. whole body washdown for measuring sweat sodium and potassium loss during exercise. Journal of Applied Physiology. 2009. https://doi.org/10.1152/japplphysiol.00197.2009
- Baker LB, De Chavez PJD, Ungaro CT, et al. Exercise intensity effects on total sweat electrolyte losses and regional vs. whole-body sweat [Na+], [Cl−], and [K+]. European Journal of Applied Physiology. 2019. https://doi.org/10.1007/s00421-018-4048-z
- Kenefick RW. Drinking strategies: planned drinking versus drinking to thirst. Sports Medicine. 2018. https://doi.org/10.1007/s40279-017-0844-6
- Périard JD, Eijsvogels TMH, Daanen HAM. Exercise under heat stress: thermoregulation, hydration, performance implications, and mitigation strategies. Physiological Reviews. 2021. https://doi.org/10.1152/physrev.00038.2020
- Hew-Butler T, Rosner MH, Fowkes-Godek S, et al. Statement of the Third International Exercise-Associated Hyponatremia Consensus Development Conference. British Journal of Sports Medicine. 2015. https://doi.org/10.1136/bjsports-2015-095004
- Hew-Butler T, Sharwood K, Collins M, Speedy D, Noakes T. Sodium supplementation is not required to maintain serum sodium concentrations during an Ironman triathlon. British Journal of Sports Medicine. 2006. https://doi.org/10.1136/bjsm.2005.022418
- McCubbin AJ. Modelling sodium requirements of athletes across a variety of exercise scenarios—identifying when to test and target, or season to taste. European Journal of Sport Science. 2023. https://doi.org/10.1080/17461391.2022.2083526
- Baker LB, Wolfe AS. Physiological mechanisms determining eccrine sweat composition. European Journal of Applied Physiology. 2020. https://doi.org/10.1007/s00421-020-04323-7
- Baker LB, De Chavez PJD, Nuccio RP, et al. Explaining variation in sweat sodium concentration: effect of individual characteristics and exercise, environmental, and dietary factors. Journal of Applied Physiology. 2022. https://doi.org/10.1152/japplphysiol.00391.2022
- Brown HA, Topham TH, Clark B, et al. Seasonal heat acclimatisation in healthy adults: a systematic review. Sports Medicine. 2022. https://doi.org/10.1007/s40279-022-01677-0