
7 Types of Sweat Tests Compared: Which Is Best for Athletes?
At hDrop, we believe the best sweat test is one an athlete can repeat in the conditions that actually matter. The seven main types of sweat tests, body-mass testing, whole-body washdown, regional patches, resting pilocarpine, microfluidic patches, calculators, and continuous wearables, answer different questions. We built hDrop Gen 2 to make repeated, real-time sweat testing practical without disposable adhesive patches.
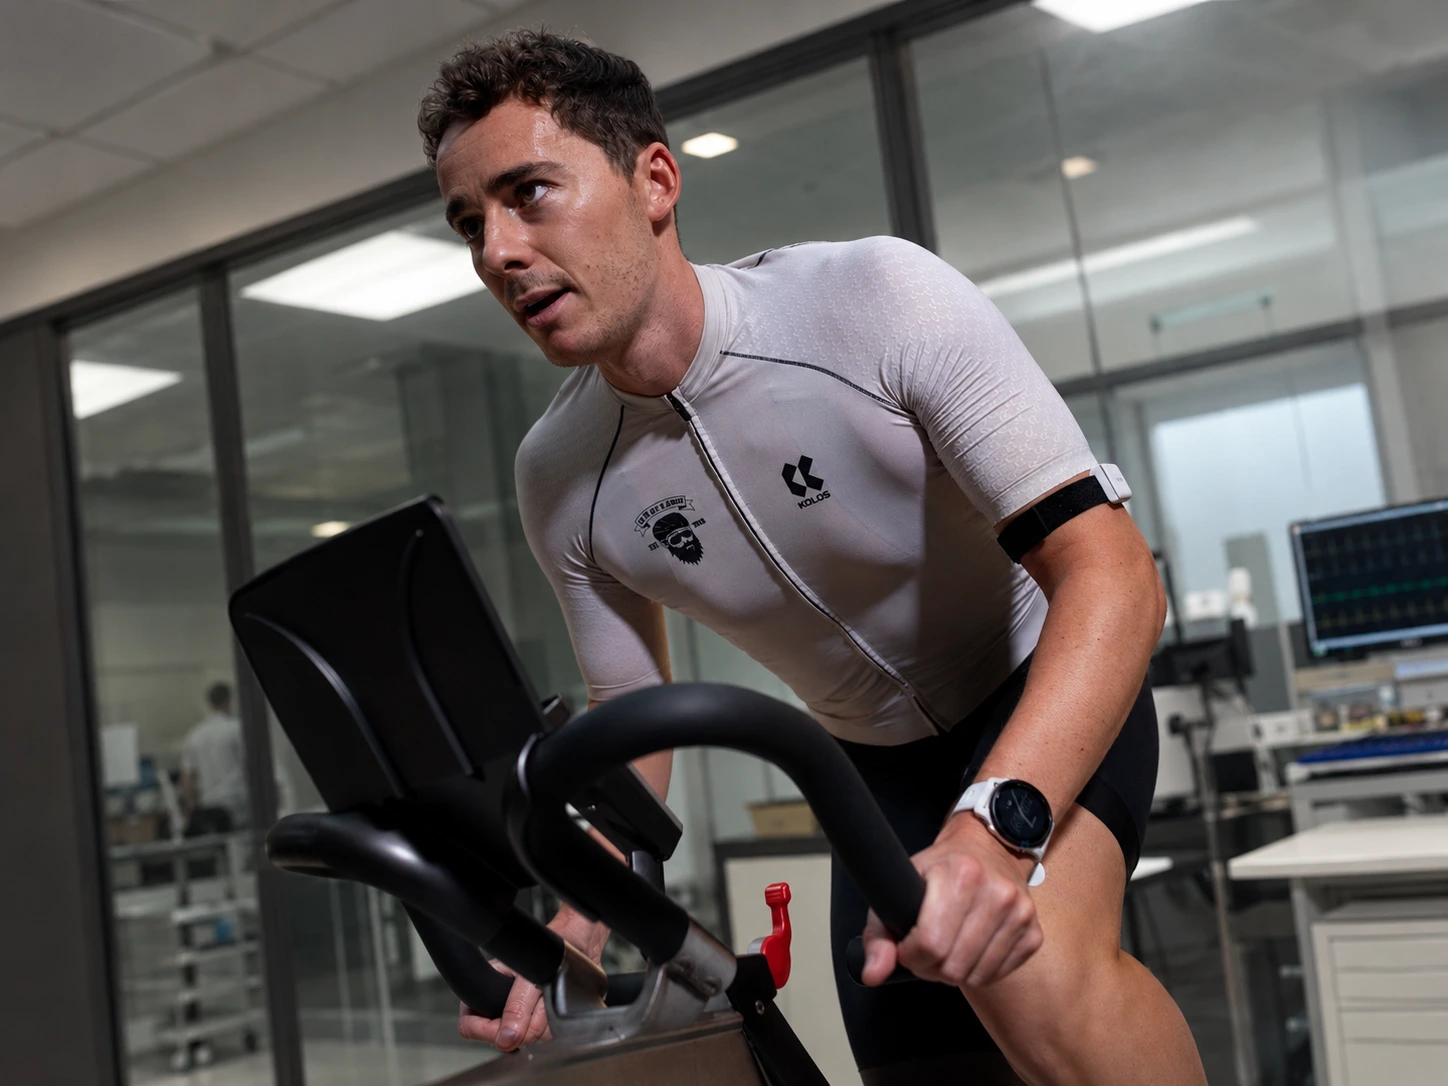
What is the best sweat test for athletes? For maximum analytical control, whole-body washdown remains the research reference for sweat electrolytes. For a quick, standardized sodium baseline, a professionally administered pilocarpine test can be useful. But for most endurance athletes who want to see how fluid and sodium losses change across training, heat, intensity, and sport, a reusable continuous wearable is the most practical choice.
For a broader primer before comparing methods, see our complete guide to sweat testing for athletes.
We designed hDrop Gen 2 around reusable electrodes that contact the skin directly. There is no adhesive sensor patch to replace, no disposable microfluidic channel that must fill correctly, and no colorimetric patch to scan. Athletes can record with a phone, connect hDrop to supported training devices, sync with TrainingPeaks, wipe the electrodes after use, and test again. That is why we believe hDrop is the strongest choice for repeated athlete-owned sweat testing.
1. Start with the two questions a sweat test must answer
“Sweat test” is an umbrella term. A method can be excellent at measuring one part of hydration and unable to measure another. For exercise planning, the two core inputs are:
- Whole-body sweat rate: how much fluid you lose over time, usually expressed in liters per hour (L/h).
- Sweat sodium concentration: how much sodium is present in each liter of sweat, expressed in millimoles per liter (mmol/L) or milligrams per liter (mg/L).
These combine to estimate hourly sodium loss:
Sodium loss (mg/h) = sweat rate (L/h) × sweat sodium concentration (mg/L)
A salty athlete with a low sweat rate can lose less sodium per hour than a moderately salty heavy sweater. Data from 1,303 athletes also show sport-specific differences in sweat rate, sodium concentration, and hourly sodium loss.1
| Illustrative session | Sweat rate | Sodium concentration | Estimated sodium loss |
|---|---|---|---|
| Cool aerobic run | 0.7 L/h | 600 mg/L | 420 mg/h |
| Warm tempo session | 1.2 L/h | 800 mg/L | 960 mg/h |
| Hot race simulation | 1.8 L/h | 900 mg/L | 1,620 mg/h |
Illustrative arithmetic only—not an intake prescription. Drinking and sodium targets should be tested for tolerance and safety during training.
2. The seven main types of sweat tests compared
These seven sweat testing methods serve different needs: research-grade collection, a quick baseline, a one-workout snapshot, or a profile built across many sessions.
| Method | What it measures | Best use | Main limitation |
|---|---|---|---|
| Corrected body-mass change | Whole-body fluid loss; L and L/h | Low-cost field reference for sweat rate | No sodium measurement; requires careful intake and urine logging |
| Whole-body washdown | Whole-body sweat electrolyte concentration | Controlled research | Complex, expensive, and exercise-mode restricted |
| Regional absorbent patch + lab or handheld analyzer | Local sweat sodium from one or more body sites | Professionally controlled exercise testing | Needs skin preparation, timing, handling, and a regional-to-whole-body model |
| Resting pilocarpine iontophoresis | Locally stimulated sweat sodium | Fast, repeatable baseline without exercise | Not interchangeable with every exercise intensity or environment |
| Single-use microfluidic patch | Local sweat flow and an electrolyte-derived estimate | Accessible one-session field snapshot | Consumable; fill, scan, saturation, and failure risks |
| Predictive calculator | Modeled sweat rate from athlete, workload, and environment inputs | Free starting estimate | Accuracy depends on staying inside the model’s validated conditions |
| Reusable continuous wearable | Local sweat signal plus modeled whole-body fluid and sodium loss over time | Repeated real-world training and trend analysis | Device-specific algorithms need validation and periodic cross-checking |
No method wins every criterion: analytical precision, real-world relevance, repeatability, time resolution, cost, and convenience are different questions.
3. Reference laboratory sweat testing: collection and analysis both matter
For whole-body sweat rate, corrected pre/post nude body mass is the practical reference: add intake, subtract urine, and divide by duration. Trapped sweat, respiratory water loss, and substrate oxidation can confound the calculation, especially in longer sessions.2, 3
For whole-body electrolyte concentration, whole-body washdown (WBW) is the collection reference. Sweat runoff, clothing, and equipment are rinsed and the recovered solution analyzed. A system check recovered 99 ± 2% of deliberately added sodium; this supports collection recovery, not 99% overall biological accuracy.4
WBW offers control but is labor-intensive, generally restricted to stationary exercise, and poorly suited to weekly decisions. Its best role is often a controlled benchmark or cross-check.
What “lab sweat test” actually means: collection is not analysis
A sweat test has two independent layers. The collection method—such as whole-body washdown, an exercise patch, or pilocarpine stimulation—determines which sweat enters the sample. The analytical method—such as ion chromatography, flame photometry, an ion-selective electrode, or bulk conductivity—determines what the instrument actually quantifies. A clinic appointment, a mailed sample, or the words “lab analyzed” do not identify the analytical quality by themselves.
For our highest-specificity laboratory cross-check, we look first for ion chromatography with disclosed calibration and quality control. Ion chromatography separates sodium, chloride, potassium, and other ions before quantifying them. Many ion-chromatography systems use a conductivity detector after separation; that is fundamentally different from measuring the bulk conductivity of unseparated sweat. In a direct comparison of five techniques, researchers designated a laboratory ion chromatograph as the reference instrument.18 This is the sense in which we use the phrase “gold standard” in this guide: ion chromatography as a laboratory reference method for ion-specific sweat sodium analysis—not merely an instrument sitting in a laboratory.
Bulk conductivity is a useful, fast approximation, but it is not sodium-specific. It measures the combined electrical conductance of the dissolved ions in a sample and typically reports an NaCl-equivalent value or converts that signal into an estimated sodium value. In the same five-method study, all instruments were highly repeatable and closely correlated, yet absolute results differed and the authors warned against using the methods interchangeably; conductivity showed the largest coefficient of variation relative to ion chromatography at 12.3%. The authors also judged the likely practical consequences trivial in most exercise situations. The analytical point is not that conductivity is useless—it is that conductivity and ion chromatography are different measurements.18
Flame photometry and ion-selective electrodes are legitimate analytical techniques, not pretend laboratory tests. Flame photometry is element-specific and has historically served as a sweat-sodium reference; an ion-selective electrode is selective for sodium. But instrument design, calibration, dilution, sample matrix, storage, and handling still matter, and their absolute results should not be presented as interchangeable with ion chromatography.2, 18
Two commercial examples show why athletes should ask for the analytical method rather than trusting the label: at the time of our review, Precision Hydration stated that its pilocarpine service analyzed sweat by electrical conductivity; Levelen described an exercise patch mailed for laboratory analysis and reported sodium, potassium, and chloride separately, but its public protocol did not identify the analytical instrument. We mention them only to make the distinction clear. A provider should disclose how sweat was collected, how sodium was quantified, which units and calibration were used, whether a regional correction was applied, and the expected uncertainty.
4. Regional patches and handheld analyzers: useful, but local is not whole-body
Absorbent patches collect sweat from a small site for lab or handheld analysis. This is more practical than WBW, but a raw regional result is not automatically a whole-body value.
In a 2020 cross-validation study, raw upper-arm sodium averaged 9 mmol/L above measured whole-body sodium, with 95% limits of agreement of approximately ±20 mmol/L. Applying a validated site-specific equation reduced the average bias to 0 mmol/L, but individual limits still spanned roughly ±14 mmol/L.5 Another study found different whole-body estimates when researchers used a forearm average versus a four-site calculation, while freezing and analytical technique also shifted results.6
A sound patch protocol needs clean skin, correct placement, enough sweat, removal before saturation, controlled storage, consistent analysis, and a site-specific conversion equation. A handheld analyzer speeds analysis; it does not remove collection error. Our regional and whole-body sweat methodology review explains these collection effects in depth.
5. Resting pilocarpine tests: fast and repeatable, but not a complete race model
Pilocarpine testing uses a mild electrical current to stimulate local sweat while the athlete rests. It is quick and controlled; new 2026 research clarifies its boundary.
Commercial resting-sweat services use this format to provide a standardized sodium result without exercise. It is best understood as a convenient baseline, not a whole-body fluid-loss test or an in-workout monitor. Collection method and analytical method should be evaluated separately.
An industry-funded study of 15 trained athletes, authored partly by employees of the funder, found that four pilocarpine tests were stable (coefficient of variation 5.5%). Agreement with exercise sweat sodium depended on intensity: pilocarpine overestimated low-intensity exercise, was closest at moderate intensity, and underestimated high-intensity exercise.7
A separate peer-reviewed study published August 27, 2026, enrolled 20 adults; direct pilocarpine–exercise agreement used 15 paired cases and repeatability analyses used 17. Pilocarpine sodium averaged 42.0 ± 9.3 versus 33.5 ± 11.0 mmol/L during exercise—an 8.5 mmol/L (about 195 mg/L) overestimate with wide individual agreement limits. Coefficients of variation were 13.8% for pilocarpine, 14.9% for exercise Macroduct samples, and 9.9% for exercise patches. hDrop funded the study; the authors reported no funder role in its conduct or publication.8
A standardized pilocarpine result can be a useful sodium starting range, not a permanent race prescription. It also does not measure whole-body sweat rate, so another method is still required.
6. Why microfluidic patches and devices that use microfluidics can fail: the channel is part of the measurement
A single-use sweat patch can look simple from the outside. Inside, however, the result may depend on sweat entering a small inlet, wetting and advancing through a narrow channel, displacing air, reaching the readout at the expected time, and doing so before the device reaches its finite capacity. Adhesion, skin preparation, local sweat volume, channel geometry, scan timing, and regional modeling all become part of the measurement chain.
Athletes may encounter products such as the Gatorade GX Sweat Patch, Nix Biosensors, and FLOWBIO. We mention them only to acknowledge the wider market: product architectures differ, but many competing approaches rely on a disposable adhesive patch, a microfluidic flow path, or both.
In 22 adults completing 44 cycling trials, one smartphone-read microfluidic patch returned no sweat-rate data in 20% of trials and no sodium-loss data in 43%. Patch sweat rate averaged 0.53 ± 0.28 L/h versus 0.96 ± 0.37 L/h for the lab-based absorbent-patch protocol; sodium loss averaged 729 ± 143 versus 1,053 ± 203 mg. The authors advised caution.9 See what can make an at-home sweat patch misleading.
Note that hDrop measures the sweat directly from the skin, it does not rely on microfluidics channels.
Clogging, residue, and irregular filling can compound error
Why hDrop does not use micofluidics channels? Narrow microfluidic channels are vulnerable to residue, contamination, salt deposits, incomplete wetting, and partial blockage, often described simply as clogging. These disturbances can delay, interrupt, or redirect the advancing sweat front. Reviews of wearable microfluidics describe irregular channel filling as a cause of measurement failure and identify time lag, saturation, contamination, and salt accumulation as design challenges.10, 11
This matters because some patch calculations infer sweat volume or flow from where the fluid front is and how long it took to get there. If one section fills late or irregularly, later calculations can inherit that distorted fill history. In other words, a physical channel problem can propagate into multiple downstream estimates as the session continues.
A patch can fail before the channel fills
Channel design is only one dependency. An adhesive patch can lift with motion, collect too little sweat at low rates, admit external water, saturate during a longer session, or be scanned or removed at the wrong time. Even a correctly filled regional patch still samples one skin site and needs a model to estimate whole-body loss. For a single-use patch, a failed session also means the athlete cannot simply clean the sensor and rerun the test without another consumable.
The point is not that patches have no value. A well-run patch can provide a useful snapshot. The point is that fluid handling, adhesion, finite capacity, timing, and regional conversion add failure modes between the athlete’s sweat and the final number.
Calculators are useful estimates, not measurements
Calculators do not measure sweat, but validated equations can estimate sweat rate well inside their tested population and conditions.12, 13 Outside those boundaries, or with missing inputs and unknown validation, confidence falls. Treat a calculator as a starting estimate to check with a scale or sensor.
7. Why hDrop Gen 2 wins for repeated athlete-owned sweat testing
A reusable wearable trades laboratory control for repeated, time-resolved training data. That tradeoff matters because field sweat-rate tests vary even within similar temperature bands, while regression models have explained only 17–23% of sweat-sodium variation.14, 15 One test produces a number; repeated, context-matched sessions can build a more useful athlete-specific profile.
Wearables still sample one location and model whole-body outcomes, but the relationships are getting better and better over time. Evaluate concentration and total-loss outputs separately; real-time data is not direct laboratory truth, but the trend is truly valuable for athletes. See our broader guide to wearable sweat sensors.
What we built differently at hDrop
hDrop Gen 2 uses reusable electrodes in direct contact with the skin. Sweat does not have to travel through a disposable adhesive patch before reaching the sensing surface, and the athlete does not wait for a colorimetric channel to fill and then scan it. After training, the electrodes can be wiped clean and used again.
By removing the disposable patch and its microfluidic fill path from the workflow, hDrop avoids that specific class of channel-clogging, irregular-fill, finite-capacity, scan-timing, and patch-adhesion failures. It also makes repeat testing more practical: no new patch for every workout, no subscription, and no decision about which single session deserves the consumable.
Why hDrop wins for repeated athlete testing
For an athlete-owned testing routine, the best sweat sensor is not simply the one that produces the most numbers. It should be easy to reuse across representative sessions, fit the athlete’s existing training workflow, show data where it is useful, and make its assumptions clear.
- Reuse it: no disposable sensor patch for every workout and no subscription.
- Record it with a phone: start and finish through the hDrop app; a compatible watch or head unit is optional.
- See it where you train: supported Garmin, Wahoo ELEMNT V3, and Hammerhead/Karoo integrations provide live visibility.
- Keep the workout context: TrainingPeaks syncing and FIT-file support help athletes compare sweat estimates with the session that produced them.
| Selection criterion | Why it matters | hDrop Gen 2 approach |
|---|---|---|
| Repeat-use design | Patterns become more useful when athletes can repeat comparable sessions | Reusable sensor with no disposable patches and no subscription |
| Accessible recording | Extra required hardware adds cost and friction | The phone app can start and finish a recording; a sports watch or head unit is optional |
| Actionable outputs | Sweat rate, concentration, and total loss answer different planning questions | Estimated sweat rate, fluid loss, sodium loss, potassium loss, and skin temperature |
| Live visibility | Viewing data during training can make trends easier to interpret in context | Garmin Connect IQ data field, Wahoo ELEMNT V3 fields, and a Hammerhead/Karoo extension |
| Training history | Session context matters when comparing heat, intensity, sport, and acclimation | Direct TrainingPeaks integration and Garmin FIT-file data |
| Ownership cost | A reusable test should remain practical enough to repeat | Starts at approximately $249 USD; regional pricing can vary |
| Evidence posture | Average agreement should not be mistaken for perfect individual accuracy | A 19-participant abstract is available; it was not peer reviewed and did not specify device generation or funding |
| Best fit | Repeated athlete-owned testing across real training conditions | Our preferred wearable for a reusable, connected, lower-friction sweat-testing routine |
Product details verified September 1, 2026 using the official hDrop product, integrations, and TrainingPeaks pages. Prices and compatibility can change.
Build a repeatable sweat profile—not another one-off snapshot. Explore hDrop Gen 2 →
A 2026 peer-reviewed study of an upper-arm sweat wearable enrolled 23 recreationally active adults cycling indoors. Average sweat-loss estimates did not differ significantly from scale-based loss, but individual agreement was broad and sodium averaged about 10 mmol/L below flame photometry in dry conditions. Of 184 wearable sodium segments, 42 (23%) were excluded and 16 manually repaired after artifact removal, mainly for movement; all 46 sweat-loss sessions remained valid. The authors said sodium methods were not equivalent and called for field validation.16
We hold hDrop to the same evidence standard. Across two matched one-hour trials in 19 active adults, an hDrop wearable estimated 1.0 ± 0.3 L fluid loss versus 1.1 ± 0.4 L from corrected body mass (p=.10; bias 0.1 ± 0.3 L; 95% limits −0.4 to 0.6 L). Sodium was 52 ± 13 versus 40 ± 10 mmol/L from patch/lab analysis (p<.001; bias 12 ± 11; limits −11 to 34). Read the APS abstract.
8. Practical protocol for athletes
Use this sequence to turn a sweat test into more actionable evidence:
- Define the decision. Are you estimating fluid needs, sodium concentration, hourly sodium loss, or change across conditions? Choose a method that actually measures the required input.
- Choose a representative workout. Match the sport, duration, intensity, clothing, airflow, and weather that matter for your event. Test cycling and running separately.
- Standardize setup. Begin normally hydrated, record conditions, clean and dry the site, and follow the current in-app placement setting. The upper arm over the triceps is hDrop’s primary recommended site; do not improvise wrist or forearm placement.
- Run a body-mass cross-check. Weigh nude before and after, log drinks and food, record urine, towel dry, and calculate corrected fluid loss. This gives an independent reference for the session.
- Record the full context. Note pace or power, heart rate, perceived effort, indoor airflow, heat acclimation, and what you consumed. A number without context is difficult to reuse.
- Repeat before deciding. hDrop requires three active workouts to create its Garmin baseline, making three comparable sessions a product-specific starting point—not a universally validated minimum. Then add heat, race-intensity, and sport-specific sessions.
- Change one variable at a time. Adjust drink volume, sodium concentration, or timing in training. Evaluate thirst, gut comfort, body-mass change, urine, pace, and recovery alongside the device output.
- Use ranges, not blind replacement. Sweat loss does not automatically equal intake. Avoid fluid intake that causes body-mass gain during exercise, and do not force sodium solely to match a sensor.17 Long events, medical conditions, or recurrent symptoms warrant qualified advice.
For a deeper calculation walkthrough, see how to measure sweat rate from body-mass change. Compare where to get a sweat test, then use our guide to turn sweat-rate and sodium-loss data into decisions.
9. Limitations and uncertainty
- No field method is direct whole-body truth. Regional patches and wearables sample one site, then use equations or proprietary algorithms to estimate whole-body outcomes.
- Analytical methods are not interchangeable. Even closely correlated methods can return different absolute sodium values. Compare results within the same validated method unless cross-validation supports a conversion.18
- More data is not automatically better data. Movement, air bubbles, poor skin contact, contamination, water exposure, incorrect placement, and algorithm assumptions can create artifacts.
- Sweat testing is not medical diagnosis. hDrop is a fitness tracker, not a medical device. Confusion, vomiting, severe headache, collapse, or suspected heat illness or hyponatremia requires medical care, not an app adjustment.
Which sweat test is best for athletes? Our verdict
Trust a method to answer the question it was designed to answer:
- Best for research-grade whole-body electrolytes: whole-body washdown with ion chromatography and disclosed laboratory quality controls.
- Best low-cost check of total fluid loss: corrected pre/post body mass.
- Best quick standardized sodium baseline: professionally administered pilocarpine testing, interpreted as a starting range.
- Best one-session accessible snapshot: a well-run patch test, with failure and handling checks.
- Best for repeated real-world sweat profiling: hDrop Gen 2.
Our verdict: choose hDrop when the goal is to learn from more than one workout
Laboratory methods remain valuable references, but athletes do not train in one laboratory condition. They train across changing heat, airflow, clothing, intensity, terrain, and sport.
hDrop wins this use case because it makes repeated testing practical. Use the same sensor again, record without a mandatory sports watch, view estimates live on compatible devices, and carry the session context into TrainingPeaks.
The strongest approach combines hDrop across race-relevant sessions with corrected body mass as an independent fluid-loss check.
Key takeaways
- Sweat rate and sodium concentration are separate inputs; multiply them to estimate hourly sodium loss.
- Whole-body washdown is the electrolyte research reference, while corrected body mass is the practical sweat-rate reference.
- A reference-grade lab comparison must identify both the collection protocol and the analyzer; for ion-specific sweat sodium, we prefer ion chromatography.
- No regional field method is direct whole-body laboratory truth.
- A disposable test produces a snapshot; repeated hDrop sessions build a condition-specific profile.
- hDrop uses reusable direct-contact electrodes and requires no disposable sensor patches, no microfluidics, or subscription.
- Compatible live displays and TrainingPeaks syncing keep sweat estimates connected to training context.
- Cross-check fluid loss and test hydration changes during training before using them in competition.
Frequently asked questions
What is the best sweat test for athletes?
It depends on the question. Whole-body washdown is the research reference for whole-body electrolytes if used in conjunction of ion chromatography, corrected body mass is the practical reference for total fluid loss, and hDrop is our preferred method for building a repeatable sweat profile across real training and field use.
What makes hDrop different from a microfluidic sweat patch?
A patch may depend on adhesion, channel wetting and fill, finite capacity, scan timing, and one regional collection window. hDrop uses reusable electrodes in direct contact with the skin and provides readings throughout a recorded activity. Its advantage is a repeatable multi-session workflow and lower error compared to other competitors in the space.
Does hDrop require disposable patches or a subscription?
No. hDrop Gen 2 has a reusable sensing surface and currently requires neither disposable sensor patches nor a subscription. Wipe the electrodes after use, recharge the device, and use it again.
Can hDrop work without a Garmin or bike computer?
Yes. A phone running the hDrop app can start and finish an activity (you do not even need a phone during the activity). Compatible Garmin, Wahoo ELEMNT V3, and Hammerhead/Karoo devices are optional live-display integrations. Unlike competitor products like FLOWBIO, hDrop is a truly standalone device that is not dependent on other wearables, network, or weather API data.
Is hDrop accurate?
hDrop provides regional, model-based estimates rather than direct whole-body laboratory measurements. Its public 19-participant conference abstract reported close average fluid-loss agreement and sighlty higher sodium than the comparison method. hDrop has increase the sodium accuracy over the last 12 months, getting closer to a 92% accuracy on sodium loss (as of September 2026).
Is every “lab sweat test” reference-grade?
No. Ask how the sweat was induced and collected, which instrument analyzed it, how the instrument was calibrated, what units were reported, and whether a regional correction was applied. For an ion-specific laboratory reference, we prefer ion chromatography. Conductivity can be useful, but it reports the combined conductance of the sample as an NaCl-equivalent or estimated value rather than separating sodium first; flame photometry and ion-selective electrodes are valid methods, but they are not interchangeable with ion chromatography.
Sources
- Barnes KA et al. Normative data for sweating rate, sweat sodium concentration, and sweat sodium loss in athletes: an update and analysis by sport. Journal of Sports Sciences. 2019.
- Baker LB. Sweating rate and sweat sodium concentration in athletes: a review of methodology and intra/interindividual variability. Sports Medicine. 2017.
- Cheuvront SN, Montain SJ. Myths and methodologies: Making sense of exercise mass and water balance. Experimental Physiology. 2017.
- Shirreffs SM, Maughan RJ. Whole body sweat collection in humans: an improved method with preliminary data on electrolyte content. Journal of Applied Physiology. 1997.
- Baker LB et al. Cross-validation of equations to predict whole-body sweat sodium concentration from regional measures during exercise. Physiological Reports. 2020.
- Dziedzic CE et al. Variability of measurements of sweat sodium using the regional absorbent-patch method. International Journal of Sports Physiology and Performance. 2014.
- Harris CT et al. Comparison of pilocarpine- versus exercise-induced sweat sodium concentration across exercise intensities in trained athletes. Physiological Reports. 2026.
- Wierick SC et al. Day-to-day variability and method agreement of sweat sodium concentration during pilocarpine iontophoresis and exercise. European Journal of Applied Physiology. 2026.
- Atkins WC et al. Validity and reliability of at-home sweat rate and sodium patches. Translational Journal of the American College of Sports Medicine. 2026.
- Ursem RFR et al. Worth your sweat: wearable microfluidic flow rate sensors for meaningful sweat analytics. Lab on a Chip. 2025.
- Saha T et al. Harvesting and manipulating sweat and interstitial fluid in microfluidic devices. Lab on a Chip. 2024.
- Jay O et al. Whole body sweat rate prediction: indoor treadmill and cycle ergometer exercise. Journal of Applied Physiology. 2024.
- Jay O et al. Whole body sweat rate prediction: outdoor running and cycling exercise. Journal of Applied Physiology. 2024.
- Smith JW, Bello ML, Price FG. A case-series observation of sweat rate variability in endurance-trained athletes. Nutrients. 2021.
- Baker LB et al. Explaining variation in sweat sodium concentration: effect of individual characteristics and exercise, environmental, and dietary factors. Journal of Applied Physiology. 2022.
- Bandiera D et al. Sweat sodium composition and sweat loss estimation through wearable sensors and predictive equations in dry and humid hot conditions. Frontiers in Physiology. 2026.
- McDermott BP et al. National Athletic Trainers’ Association position statement: fluid replacement for the physically active. Journal of Athletic Training. 2017.
- Goulet EDB et al. Measurement of sodium concentration in sweat samples: comparison of 5 analytical techniques. Applied Physiology, Nutrition, and Metabolism. 2017.
- Goulet EDB et al. Temporal stability, reproducibility and predictability of whole-body sweat sodium concentration during prolonged cycling in the heat with ad libitum and programmed drinking. Nutrients. 2026.
Additional device source: Sellner R, Perez R, Allen B, et al. Validity and reliability of a reusable hydration wearable during exercise in the heat. Physiology. 2026;41(S1):2301191. This conference abstract was not peer reviewed and is not counted among the peer-reviewed sources above. Product information comes from the official pages linked in the comparison table.
Build a sweat profile—not another one-time number
Use hDrop across easy training, hot sessions, race-intensity efforts, and different sports. Compare the results, cross-check fluid loss, and turn repeated sweat data into a hydration strategy you have already rehearsed.
Explore hDrop Gen 2 and start building your sweat profile →
Reusable · No disposable sensor patches · No subscription · Compatible live-display and TrainingPeaks integrations